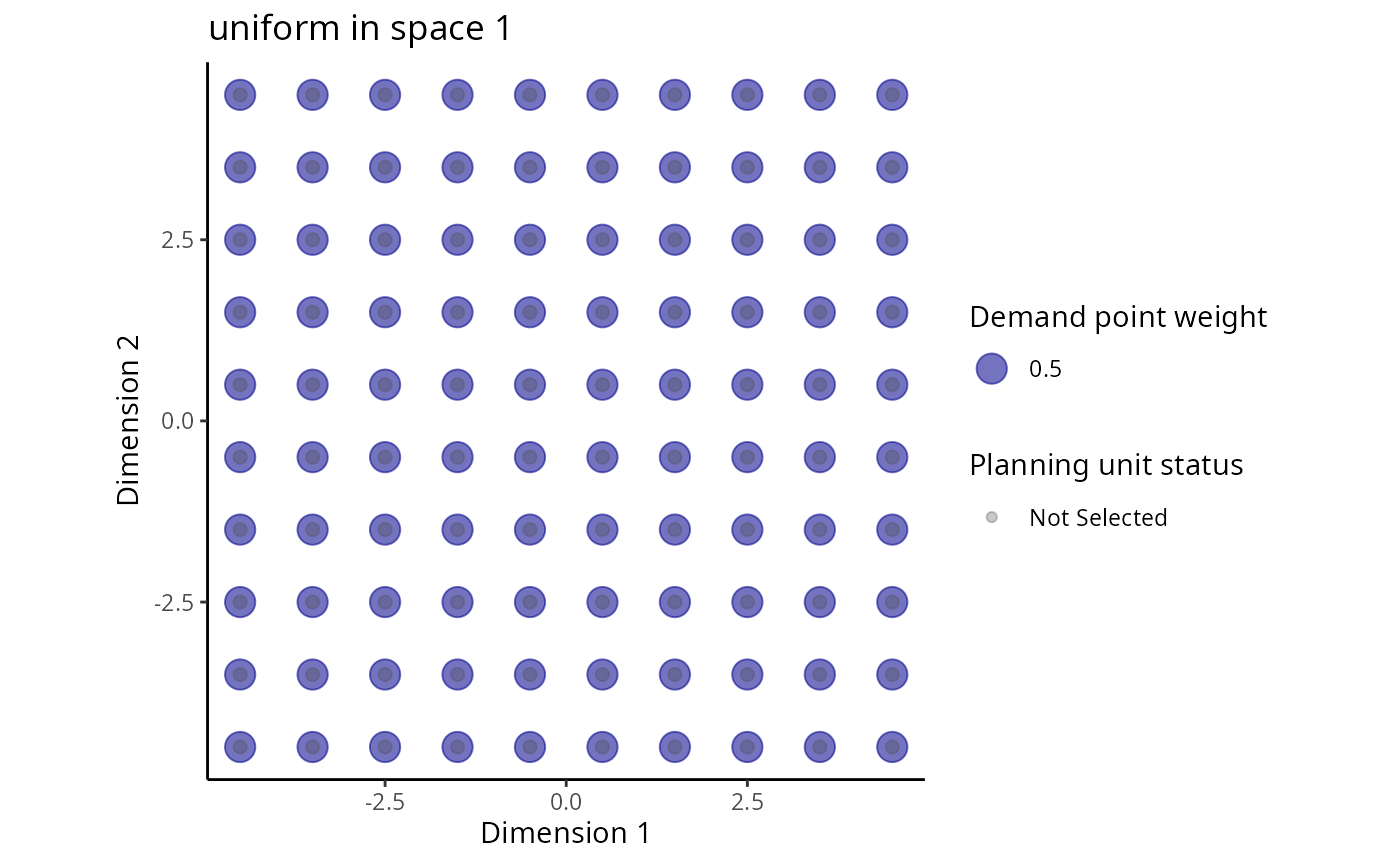
This function plots the distribution of planning units and the distribution of demand points for a particular species in an attribute space. Note that this function only works for attribute spaces with one, two, or three dimensions.
space.plot(x, species, space, ...)

# S3 method for RapData
space.plot(
  x,
  species,
  space = 1,
  pu.color.palette = c("#4D4D4D4D", "#00FF0080", "#FFFF0080", "#FF00004D"),
  main = NULL,
  ...
)

# S3 method for RapUnsolved
space.plot(
  x,
  species,
  space = 1,
  pu.color.palette = c("#4D4D4D4D", "#00FF0080", "#FFFF0080", "#FF00004D"),
  main = NULL,
  ...
)

# S3 method for RapSolved
space.plot(
  x,
  species,
  space = 1,
  y = 0,
  pu.color.palette = c("#4D4D4D4D", "#00FF0080", "#FFFF0080", "#FF00004D"),
  main = NULL,
  ...
)
Arguments
- x
RapData(),RapUnsolved(), orRapSolved()object.- species
charactername of species, orintegerindex for species.- space
integerindex of attribute space.- ...
not used.
- pu.color.palette
charactervector of colors indicate planning unit statuses. Defaults toc("grey30", "green", "black", "red")which indicate not selected, selected, locked in, and locked out (respectively).- main
charactertitle for the plot. Defaults toNULLand a default title is used.- y
integernumber specifying the solution to be plotted. The value0can be used to plot the best solution.
Examples
# \dontrun{
# load RapSolved objects
data(sim_ru, sim_rs)
# plot first species in first attribute space
space.plot(sim_ru, 1, 1)
 # plot distribution of solutions for first species in first attribute space
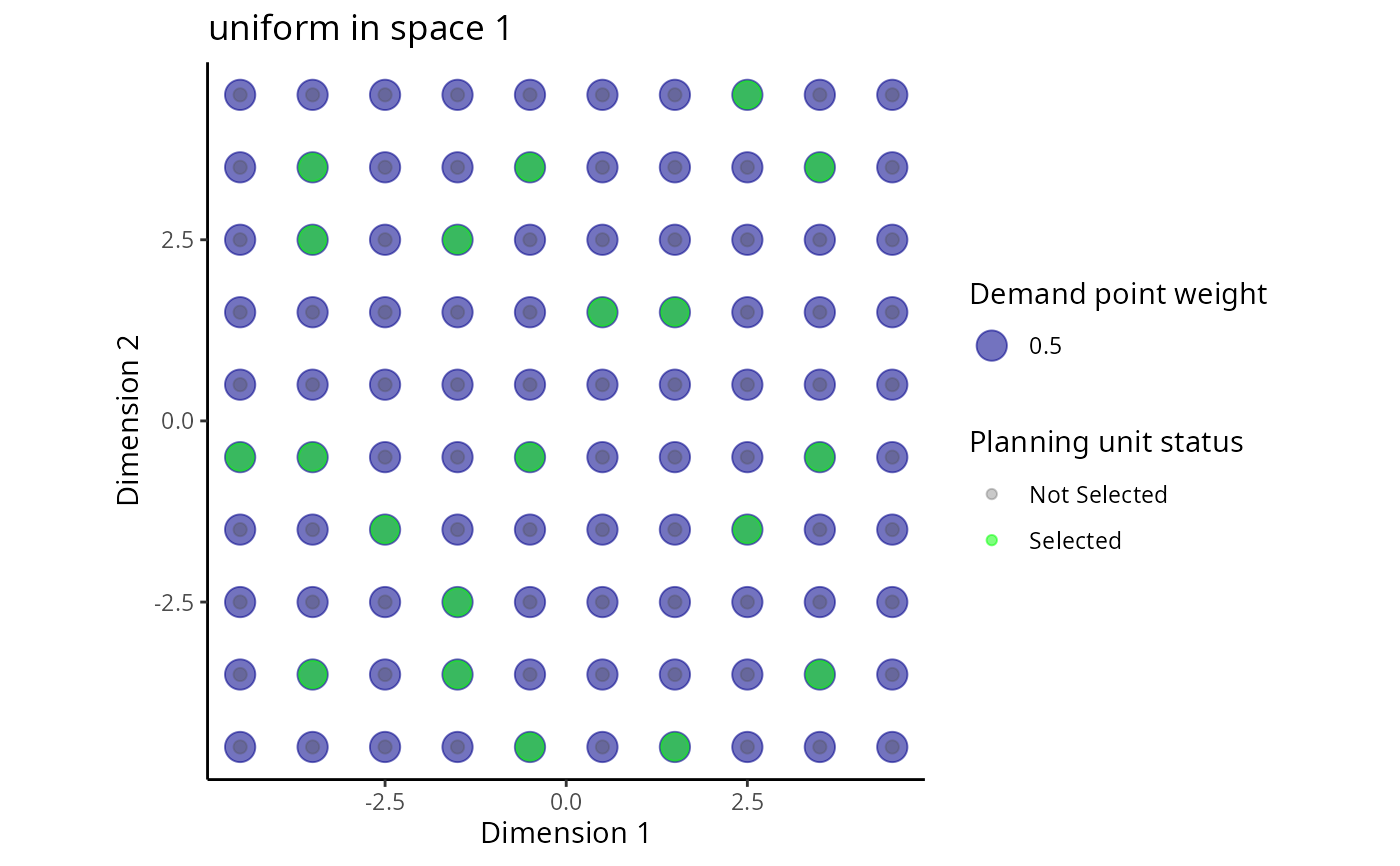
space.plot(sim_rs, 1, 1)
# plot distribution of solutions for first species in first attribute space
space.plot(sim_rs, 1, 1)
 # }
# }