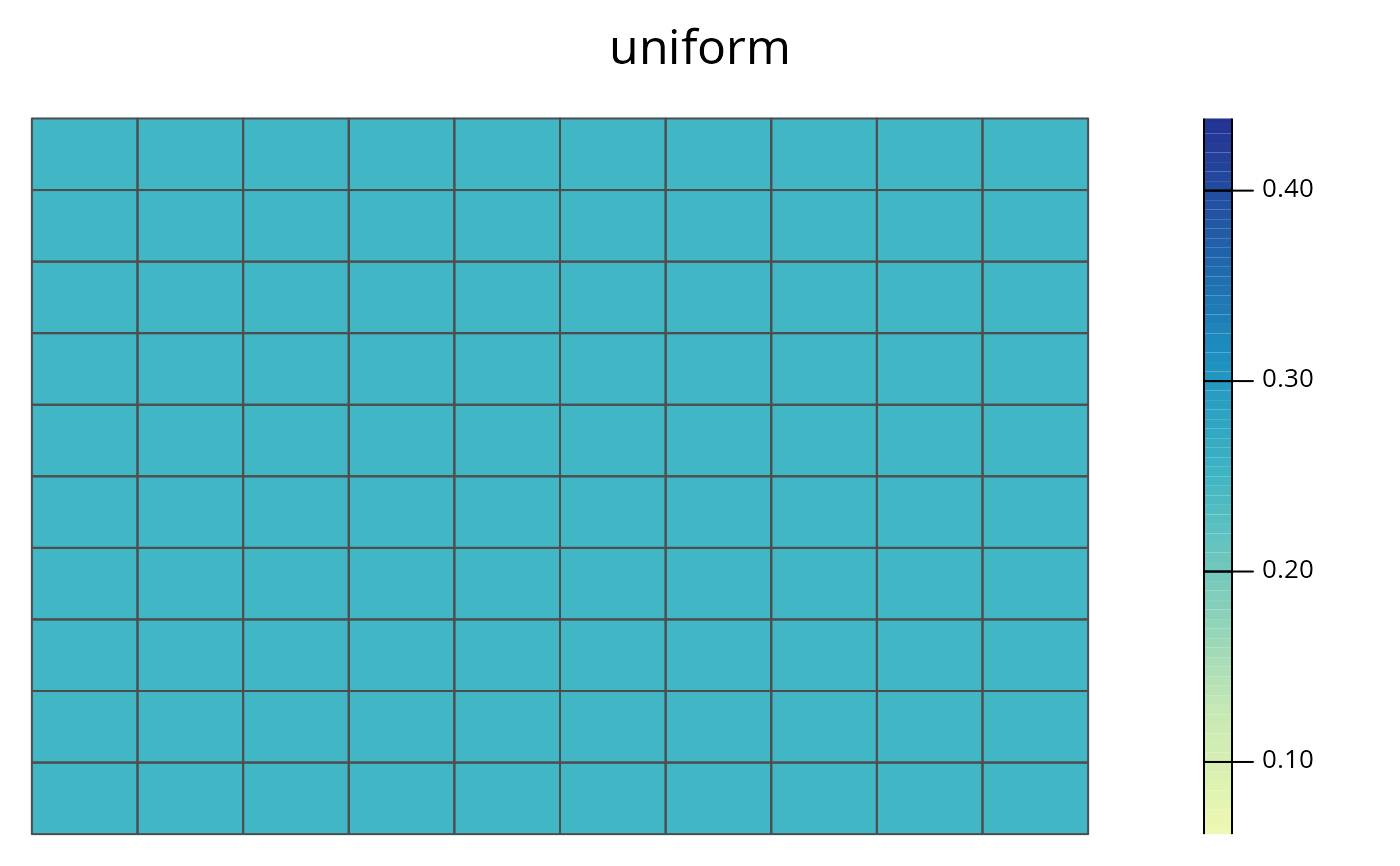
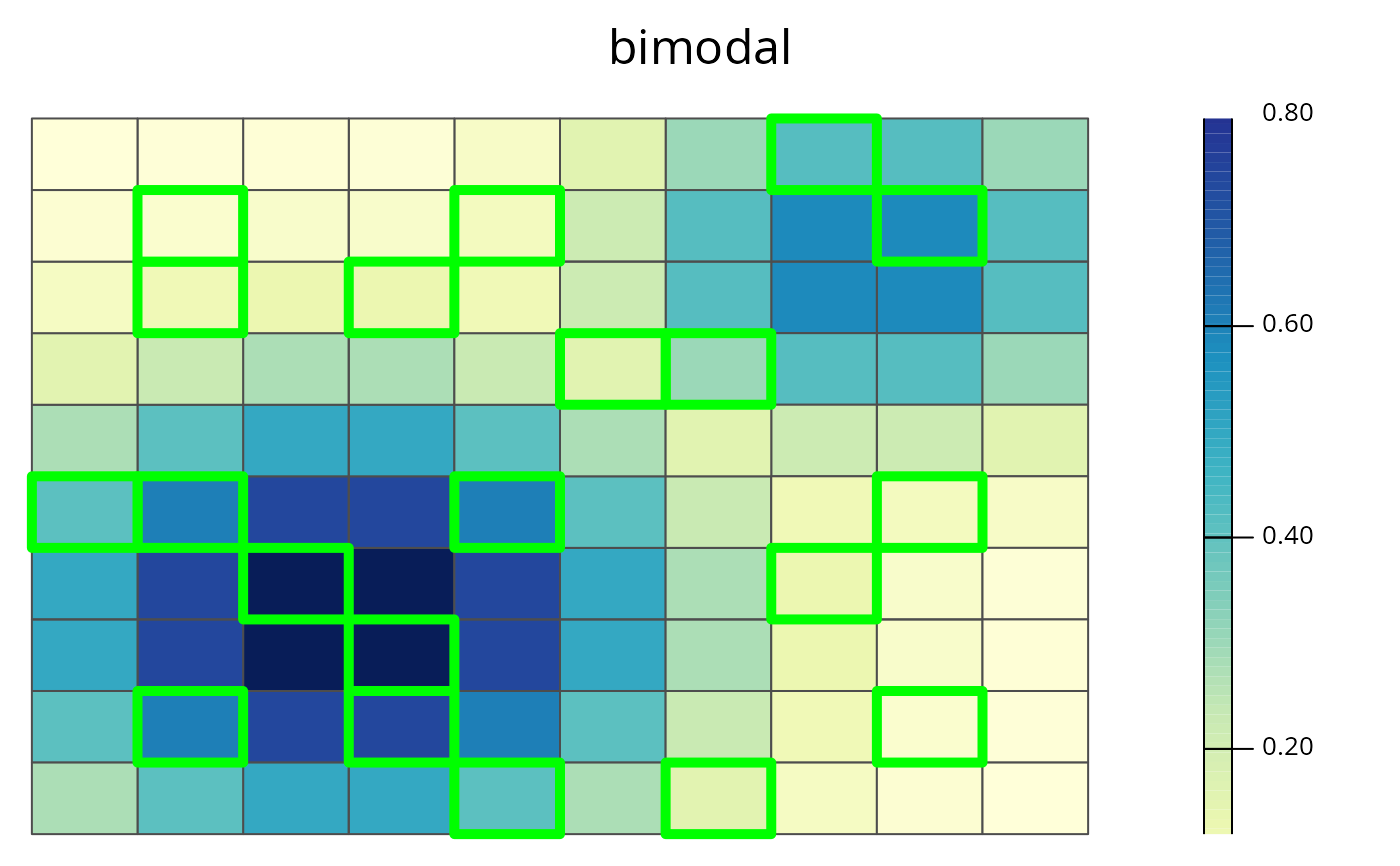
This function plots the distribution of species across the study area.
spp.plot(x, species, ...)

# S3 method for RapData
spp.plot(
  x,
  species,
  prob.color.palette = "YlGnBu",
  pu.color.palette = c("#4D4D4D", "#00FF00", "#FFFF00", "#FF0000"),
  basemap = "none",
  alpha = ifelse(identical(basemap, "none"), 1, 0.7),
  grayscale = FALSE,
  main = NULL,
  force.reset = FALSE,
  ...
)

# S3 method for RapUnsolved
spp.plot(
  x,
  species,
  prob.color.palette = "YlGnBu",
  pu.color.palette = c("#4D4D4D", "#00FF00", "#FFFF00", "#FF0000"),
  basemap = "none",
  alpha = ifelse(basemap == "none", 1, 0.7),
  grayscale = FALSE,
  main = NULL,
  force.reset = FALSE,
  ...
)

# S3 method for RapSolved
spp.plot(
  x,
  species,
  y = 0,
  prob.color.palette = "YlGnBu",
  pu.color.palette = c("#4D4D4D", "#00FF00", "#FFFF00", "#FF0000"),
  basemap = "none",
  alpha = ifelse(basemap == "none", 1, 0.7),
  grayscale = FALSE,
  main = NULL,
  force.reset = FALSE,
  ...
)
Arguments
- x
RapData(),RapUnsolved(), orRapSolved()object.- species
charactername of species, orintegerindex for species.- ...
not used.
- prob.color.palette
charactername of color palette to denote probability of occupancy of the species in planning units (seeRColorBrewer::brewer.pal()). Defaults to"YlGnBu".- pu.color.palette
charactervector of colors to indicate planning unit statuses. Defaults toc("grey30", "green", "black", "red")which indicate not selected, selected, locked in, and locked out (respectively).- basemap
characterobject indicating the type of basemap to use (seebasemap()). Valid options include"none","roadmap","mobile","satellite","terrain","hybrid","mapmaker-roadmap","mapmaker-hybrid". Defaults to"none"such that no basemap is shown.- alpha
numericvalue to indicating the transparency level for coloring the planning units.- grayscale
logicalshould the basemap be gray-scaled?- main
charactertitle for the plot. Defaults toNULLand a default title is used.- force.reset
logicalif basemap data has been cached, should it be re-downloaded?- y
NULLinteger0 to return values for the best solution,integervalue greater than 0 fory'th solution value.
Details
This function requires the RgoogleMaps package to be installed in order to create display a basemap.
Examples
# \dontrun{
# load RapSolved objects
data(sim_ru, sim_rs)
# plot first species in sim_ru
spp.plot(sim_ru, species = 1)
 # plot "bimodal" species in sim_rs
spp.plot(sim_rs, species = "bimodal")
# plot "bimodal" species in sim_rs
spp.plot(sim_rs, species = "bimodal")
 # }
# }